Links to Interesting Stuff About Climate Science
BARRY BRILL: A Climate Crisis? Let's Ask an Expert
“In my opinion, there is no real climate crisis.”
This carefully-considered public statement was made in May 2023 by Dr John Clauser, recipient of the 2022 Nobel Prize in physics [1]. Physics is, of course, at the heart of climate science – and Dr Clauser has special expertise in the way cloud feedbacks are processed in global climate models (GCMs).
Climate Facts
An extensive library of facts on climate
An extensive library of facts on climate
|
A Letter from the Coast Reporter Sept.13th Sunshine Coast BC - Canada
Letters, Sept. 6), based on half a century working as a geologist on earth science information. Increased since the industrial revolution. Greenhouse gases like CO2 [1%] and water vapor [99%] have a modifying influence on temperature. However, the major controller of temperature is the intensity of solar radiation incident upon the earth. Firstly, the atmosphere is a thermodynamic system. Energy cannot be created or destroyed. The energy produced by humanity to produce CO2 is less than one 5,000th of total solar energy on the earth’s surface. Humanity’s energy input is miniscule. Its ability to raise the temperature is small. Secondly, the formation and melting of the North American ice sheet over the past 10 to 15,000 years is caused by the cyclic precession of the earth’s axis of rotation changing the angle of incidence of solar radiation and influencing the atmospheric temperature at the earth’s surface. The ice sheet is still melting because Canada is moving solar south at the rate of about one degree every 70 years. Thirdly, CO2 is a vital component of the atmosphere. Every living thing contains carbon that once circulated in the air as CO2. The primary natural sources of CO2 are the degassing of 500 terrestrial volcanic fields on the planet. The biosphere constantly consumes CO2 and stores it in the sink. If it was not resupplied all things on earth would die. CO2 is not pollution. Finally, selectively collecting data to prove preconceived, human-caused climate change is not science. It is case making. My personal environmental catechism is: clean air and water and conservation of energy and materials. Albert Reeve, Gibsons BC - Canada |
Alarmist Claim Rebuttals
A summary of all the alarmist claims together with their rebuttals
A summary of all the alarmist claims together with their rebuttals
Comprehensive document to aid in understanding climate change
| climate_change_understanding.pdf | |
| File Size: | 852 kb |
| File Type: | |
What if there is no Climate Emergency?
Charles Rotter / October 7, 2019
Also discussing the Logarithmic diminution effect...
Charles Rotter / October 7, 2019
Also discussing the Logarithmic diminution effect...
CEI Files Formal Complaint Regarding NASA's Claim of 97% Climate Scientist Agreement on Global Warming
The Competitive Enterprise Institute (CEI) petitioned NASA to remove from its website the claim that 97 percent of climate scientists agree humans are responsible for global warming. The petition, filed under the Information Quality Act (IQA), points out the major flaws in the studies cited by NASA to substantiate its claim. It requests the agency remove the claim from its website and stop circulating it in agency materials.
You can read the full Request for Correction here.
Global Warming Petition Project
A review of the research literature concerning the environmental consequences of increased levels of atmospheric carbon dioxide leads to the conclusion that increases during the 20th and early 21st centuries have produced no deleterious effects upon Earth's weather and climate. Increased carbon dioxide has, however, markedly increased plant growth. Predictions of harmful climatic effects due to future increases in hydrocarbon use and minor greenhouse gases like CO2 do not conform to current experimental knowledge. The environmental effects of rapid expansion of the nuclear and hydrocarbon energy industries are discussed.
A review of the research literature concerning the environmental consequences of increased levels of atmospheric carbon dioxide leads to the conclusion that increases during the 20th and early 21st centuries have produced no deleterious effects upon Earth's weather and climate. Increased carbon dioxide has, however, markedly increased plant growth. Predictions of harmful climatic effects due to future increases in hydrocarbon use and minor greenhouse gases like CO2 do not conform to current experimental knowledge. The environmental effects of rapid expansion of the nuclear and hydrocarbon energy industries are discussed.
It's official: No U.S. warming since at least 2005
"Climate-change skeptics have pointed to examples such as Penn State Professor Michael Mann's iconic "hockey stick" graph purporting to show a spike in average global temperatures in the 20th century. Mann lost a defamation suit last week after failing to present evidence to back his claim. Critics argue his graph doesn't take into account periods such as the Little Ice Age and the Medieval Warming Period."
"Climate-change skeptics have pointed to examples such as Penn State Professor Michael Mann's iconic "hockey stick" graph purporting to show a spike in average global temperatures in the 20th century. Mann lost a defamation suit last week after failing to present evidence to back his claim. Critics argue his graph doesn't take into account periods such as the Little Ice Age and the Medieval Warming Period."
Reply to critics: Heartland Institute
Link to the Heartland Institute's website and the replies to their critics. It particularly shows that they are not funded by Exon or the Kochs
Link to the Heartland Institute's website and the replies to their critics. It particularly shows that they are not funded by Exon or the Kochs
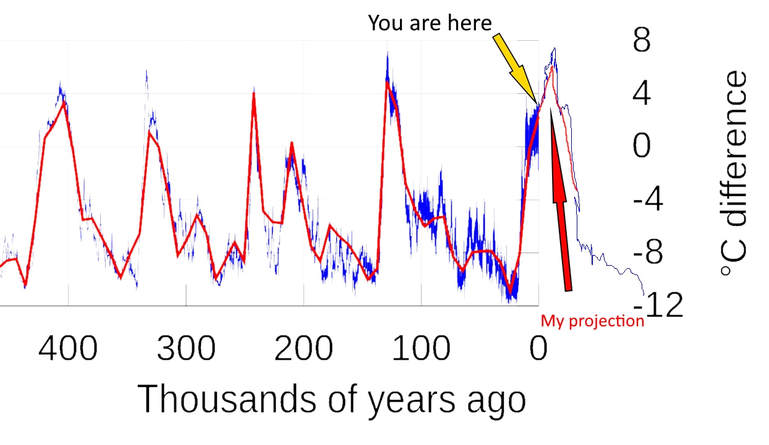
My Prediction
Do you feel lucky?
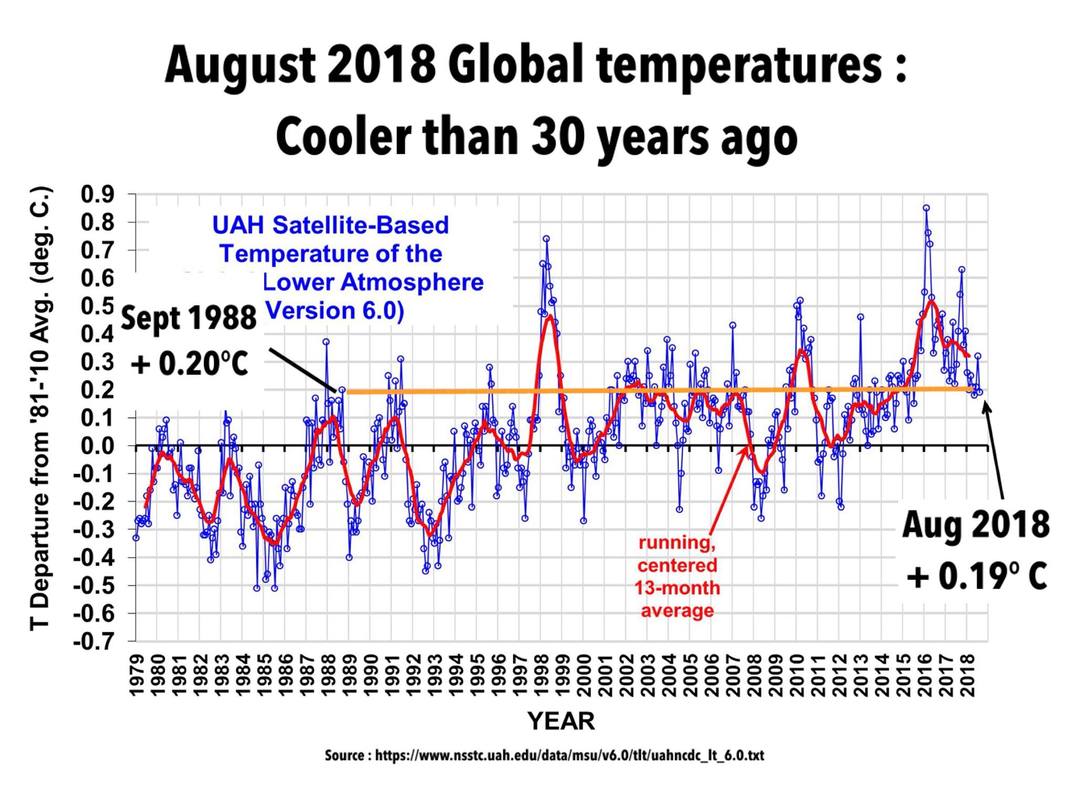
Another look at what has been happening
|
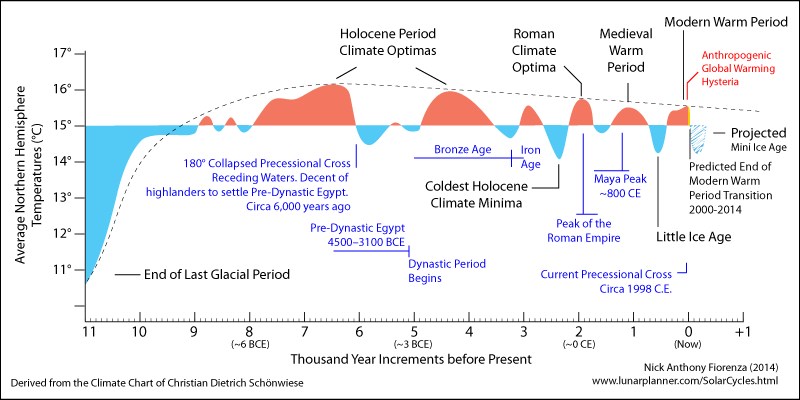
Can anyone explain this trend? I know the predicted end of the modern warm period is a little out, but wouldn't it be nice if we could have it last a little longer?
|
|
|
"Computer models do a good job of helping us understand climate but they do a very poor job of predicting it.That is according to physicist Freeman Dyson of the Institute of Advanced Study in Princeton, New Jersey.Dyson says, “As measured from space, the whole earth is growing greener as a result of carbon dioxide, so it’s increasing agricultural yields, it’s increasing the forests and it’s increasing growth in the biological world, and that’s more important and more certain than the effects on climate.”He acknowledges that human activity has an effect on climate but claims it is much less than is claimed. He stresses the non-climate benefits of carbon are overwhelmingly favourable."
|
|
|
Jordan Peterson on Climate Change
No |
|
|
Malcolm Roberts putting CO2 in perspective in an Aussie accent.
|
|
|
CO2 contributed by humans
|
|
|
Environmental Effects of Increased Atmospheric Carbon Dioxide
ARTHUR B. ROBINSON, NOAH E. ROBINSON, AND WILLIE SOON |
"Conclusions:
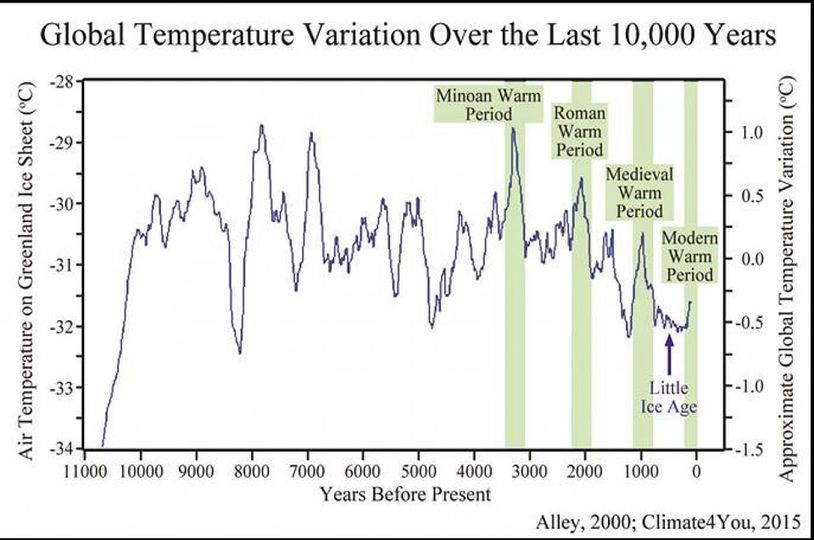
There are no experimental data to support the hypothesis that increases in human hydrocarbon use or in atmospheric carbon dioxide and other greenhouse gases are causing or can be expected to cause unfavorable changes in global temperatures, weather, or landscape. There is no reason to limit human production of CO2, CH4, and other minor greenhouse gases as has been proposed (82,83,97,123). We also need not worry about environmental calamities even if the current natural warming trend continues. The Earth has been much warmer during the past 3,000 years without catastrophic effects. Warmer weather extends growing seasons and generally improves the habitability of colder regions. As coal, oil, and natural gas are used to feed and lift from poverty vast numbers of people across the globe, more CO2 will be released into the atmosphere. This will help to maintain and improve the health, longevity, prosperity, and productivity of all people. The United States and other countries need to produce more energy, not less. The most prac ti cal, economical, and environmentally sound methods available are hydrocarbon and nuclear technologies. Human use of coal, oil, and natural gas has not harmfully warmed the Earth, and the extrapolation of current trends shows that it will not do so in the foreseeable future. The CO2 produced does, however, accelerate the growth rates of plants and also permits plants to grow in drier regions. Animal life, which depends upon plants, also flourishes, and the diversity of plant and animal life is increased. Human activities are producing part of the rise in CO2 in the atmosphere. Mankind is moving the carbon in coal, oil, and natural gas from be low ground to the atmosphere, where it is available for conversion into living things. We are living in an increasingly lush environment of plants and animals as a result of this CO2 in crease. Our children will therefore en joy an Earth with far more plant and animal life than that with which we now are blessed."
There are no experimental data to support the hypothesis that increases in human hydrocarbon use or in atmospheric carbon dioxide and other greenhouse gases are causing or can be expected to cause unfavorable changes in global temperatures, weather, or landscape. There is no reason to limit human production of CO2, CH4, and other minor greenhouse gases as has been proposed (82,83,97,123). We also need not worry about environmental calamities even if the current natural warming trend continues. The Earth has been much warmer during the past 3,000 years without catastrophic effects. Warmer weather extends growing seasons and generally improves the habitability of colder regions. As coal, oil, and natural gas are used to feed and lift from poverty vast numbers of people across the globe, more CO2 will be released into the atmosphere. This will help to maintain and improve the health, longevity, prosperity, and productivity of all people. The United States and other countries need to produce more energy, not less. The most prac ti cal, economical, and environmentally sound methods available are hydrocarbon and nuclear technologies. Human use of coal, oil, and natural gas has not harmfully warmed the Earth, and the extrapolation of current trends shows that it will not do so in the foreseeable future. The CO2 produced does, however, accelerate the growth rates of plants and also permits plants to grow in drier regions. Animal life, which depends upon plants, also flourishes, and the diversity of plant and animal life is increased. Human activities are producing part of the rise in CO2 in the atmosphere. Mankind is moving the carbon in coal, oil, and natural gas from be low ground to the atmosphere, where it is available for conversion into living things. We are living in an increasingly lush environment of plants and animals as a result of this CO2 in crease. Our children will therefore en joy an Earth with far more plant and animal life than that with which we now are blessed."
|
|
Re-evaluating the role of solar variability on Northern Hemisphere temperature trends since
the 19th century Connolly, Connolly and Soon |
"When we compared our new composite to one of the high solar variability reconstructions of Total Solar Irradiance which was not considered by the CMIP5 hindcasts (i.e., the Hoyt & Schatten reconstruction), we found a remarkably close fit. If the Hoyt & Schatten reconstruction and our new Northern Hemisphere
temperature trend estimates are accurate, then it seems that most of the temperature trends since at least 1881 can be explained in terms of solar variability, with atmospheric greenhouse gas concentrations providing at most a minor contribution. This contradicts the claim by the latest Intergovernmental Panel on Climate Change (IPCC) reports that most of the temperature trends since the 1950s are due to changes in atmospheric greenhouse gas concentrations
temperature trend estimates are accurate, then it seems that most of the temperature trends since at least 1881 can be explained in terms of solar variability, with atmospheric greenhouse gas concentrations providing at most a minor contribution. This contradicts the claim by the latest Intergovernmental Panel on Climate Change (IPCC) reports that most of the temperature trends since the 1950s are due to changes in atmospheric greenhouse gas concentrations
|
|
Professor Ian Plimer - Geologist and Earth Scientist
|
|
|
Prof. Tim Ball provides a comprehensive overview of the eugenic origins of CO2 alarmism
|
|
|
Greening of Planet Earth Introduction - Craig D. Idso
|
Latest Articles by Connollys
- CLIMATE SCIENCE
Urbanization bias III. Estimating the extent of bias in the Historical Climatology Network datasetsR. Connolly, and M. Connolly (2014).
Open Peer Rev. J., 34 (Clim. Sci.),, ver. 0.1 (non peer reviewed draft).
URL: http://oprj.net/articles/climate-science/34
- CLIMATE SCIENCE
Urbanization bias II. An assessment of the NASA GISS urbanization adjustment methodR. Connolly, and M. Connolly (2014).
Open Peer Rev. J., 31 (Clim. Sci.), ver. 0.1 (non peer reviewed draft).
URL: http://oprj.net/articles/climate-science/31
- CLIMATE SCIENCE
Urbanization bias I. Is it a negligible problem for global temperature estimates?R. Connolly, and M. Connolly (2014).
Open Peer Rev. J., 28 (Clim. Sci.), ver. 0.2 (non peer reviewed draft).
URL: http://oprj.net/articles/climate-science/28
- ATMOSPHERIC SCIENCE
The physics of the Earth’s atmosphere III. Pervective powerM. Connolly, and R. Connolly (2014).
Open Peer Rev. J., 25 (Atm. Sci.), ver. 0.1 (non peer reviewed draft).
URL: http://oprj.net/articles/atmospheric-science/25
- ATMOSPHERIC SCIENCE
The physics of the Earth’s atmosphere II. Multimerization of atmospheric gases above the troposphereM. Connolly, and R. Connolly (2014).
Open Peer Rev. J., 22 (Atm. Sci.), ver. 0.1 (non peer reviewed draft).
URL: http://oprj.net/articles/atmospheric-science/22
- ATMOSPHERIC SCIENCE
The physics of the Earth’s atmosphere I. Phase change associated with tropopauseM. Connolly, and R. Connolly (2014).
Open Peer Rev. J., 19 (Atm. Sci.), ver. 0.1 (non peer reviewed draft).
URL: http://oprj.net/articles/atmospheric-science/19
- CLIMATE SCIENCE
Global temperature changes of the last millenniumR. Connolly, and M. Connolly (2014).
Open Peer Rev. J., 16 (Clim. Sci.), ver. 1.0.
URL: http://oprj.net/articles/climate-science/16
- CLIMATE SCIENCE
Has poor station quality biased U.S. temperature trend estimates?R. Connolly, and M. Connolly (2014).
Open Peer Rev. J., 11 (Clim. Sci.), ver. 0.1 (non peer reviewed draft).
URL: http://oprj.net/articles/climate-science/11
Abstract
Atmospheric methane (CH4) contributes to the radiative forcing of Earth’s atmosphere. Radiative forcing is the difference in the net upward thermal radiation from the Earth through a transparent atmosphere and radiation through an otherwise identical atmosphere with greenhouse gases. Radiative forcing, normally specified in units of W m−2 , depends on latitude, longitude and altitude, but it is often quoted for a representative temperate latitude, and for the altitude of the tropopause, or for the top of the atmosphere. For current concentrations of greenhouse gases, the radiative forcing at the tropopause, per added CH4 molecule, is about 30 times larger than the forcing per added carbon-dioxide (CO2) molecule. This is due to the heavy saturation of the absorption band of the abundant greenhouse gas, CO2. But the rate ofincrease of CO2 molecules, about 2.3 ppm/year (ppm = part per million by mole), is about 300 times larger than the rate of increase of CH4 molecules, which has been around 0.0076 ppm/year since the year 2008. So the contribution of methane to the annual increase in forcing is one tenth (30/300) that of carbon dioxide. The net forcing increase from CH4 and CO2 increases is about 0.05 W m−2 year−1 . Other things being equal, this will cause a temperature increase of about 0.012 C year−1 . Proposals to place harsh restrictions on methane emissions because of warming fears are not justified by facts.
Atmospheric methane (CH4) contributes to the radiative forcing of Earth’s atmosphere. Radiative forcing is the difference in the net upward thermal radiation from the Earth through a transparent atmosphere and radiation through an otherwise identical atmosphere with greenhouse gases. Radiative forcing, normally specified in units of W m−2 , depends on latitude, longitude and altitude, but it is often quoted for a representative temperate latitude, and for the altitude of the tropopause, or for the top of the atmosphere. For current concentrations of greenhouse gases, the radiative forcing at the tropopause, per added CH4 molecule, is about 30 times larger than the forcing per added carbon-dioxide (CO2) molecule. This is due to the heavy saturation of the absorption band of the abundant greenhouse gas, CO2. But the rate ofincrease of CO2 molecules, about 2.3 ppm/year (ppm = part per million by mole), is about 300 times larger than the rate of increase of CH4 molecules, which has been around 0.0076 ppm/year since the year 2008. So the contribution of methane to the annual increase in forcing is one tenth (30/300) that of carbon dioxide. The net forcing increase from CH4 and CO2 increases is about 0.05 W m−2 year−1 . Other things being equal, this will cause a temperature increase of about 0.012 C year−1 . Proposals to place harsh restrictions on methane emissions because of warming fears are not justified by facts.
| co2_coalition_methane_and_climate.pdf | |
| File Size: | 894 kb |
| File Type: | |
Researchers show that global warming happened just as fast in the past as today
Climate change is progressing rapidly. It is not the first time in our planet's history that temperatures have been rising, but it is happening much faster now than it ever has before. Or is it? Researchers at Friedrich-Alexander-Universität Erlangen-Nürnberg have shown in the latest edition of the journal Nature Communications that the temperature changes millions of years ago probably happened no more slowly than they are happening today.
Climate change is progressing rapidly. It is not the first time in our planet's history that temperatures have been rising, but it is happening much faster now than it ever has before. Or is it? Researchers at Friedrich-Alexander-Universität Erlangen-Nürnberg have shown in the latest edition of the journal Nature Communications that the temperature changes millions of years ago probably happened no more slowly than they are happening today.
Muriel Newman: Mother Nature rules our planet
"In comparison with nature, the contribution of mankind to greenhouse gases is infinitesimal: of the 0.036 per cent of carbon dioxide in the atmosphere, 97 per cent is from natural sources and three per cent is created by human activity. Of the 0.00015 per cent of methane in the atmosphere, 82 per cent is from natural sources, with 18 per cent produced mainly by landfills and rice paddies, as well as farming. Altogether, the contribution of mankind to the greenhouse effect is 0.3 per cent — 99.7 per cent is natural."
"In comparison with nature, the contribution of mankind to greenhouse gases is infinitesimal: of the 0.036 per cent of carbon dioxide in the atmosphere, 97 per cent is from natural sources and three per cent is created by human activity. Of the 0.00015 per cent of methane in the atmosphere, 82 per cent is from natural sources, with 18 per cent produced mainly by landfills and rice paddies, as well as farming. Altogether, the contribution of mankind to the greenhouse effect is 0.3 per cent — 99.7 per cent is natural."
Re-evaluating the role of solar variability on Northern Hemisphere temperature trends since the 19th century
Connolly, Connolly and Soon
Connolly, Connolly and Soon
Climate change: How eating steak and hamburgers can make a difference | Nissa Enos
Young reporter analyses how good grazing practice can grow our soil rather than deplete it.
Young reporter analyses how good grazing practice can grow our soil rather than deplete it.
The Climate Skeptic - Warren Myer - with links to his Forbes articles.
Top physicist - Freeman Dyson
A MATHEMATICAL discovery by Perth-based electrical engineer Dr David Evans
may change everything about the climate debate, on the eve of the UN climate change conference in Paris next month.
What scientists say about climate change? Does the data validate the politicians, celebrities and journalists who say humans are causing the earth to catastrophically warm? Richard Lindzen, an MIT atmospheric physicist and one of the world's leading climatologists, summarizes the science behind climate change..
Dr Tim Ball Crushes Climate Change
'Hockey Stick' Mann takes Tim Ball to Court - Backfires
Yes, the Ocean has Warmed, No, it's not Global Warming
Ocean Indicators Suggest that CO2 is not the Strongest Driver of Climate
The history of ice on Earth
"The cool temperatures of the Quaternary may have allowed our brains to become much larger than those of our of hominid ancestors. While that’s still open to debate, it’s plausible that the most recent glacial period left its mark on our species.
Neanderthals, with whom we shared the planet until just before the last glacial maximum, 20,000 years ago, may have struggled to survive as the rising and falling ice ate away at their habitat – although many other explanations for their extinction have been suggested. What is beyond doubt is that Homo sapiens survived and turned to farming soon after the ice retreated, setting the stage for the rise of modern civilisation.
As the glacial period drew to a close and temperatures began to rise, there were two final cold snaps. First, the chilly “Older Dryas” of 14,700 to 13,400 years ago transformed most of Europe from forest to tundra, like modern-day Siberia. After a brief respite, the Younger Dryas, between 12,800 to 11,500 years ago, froze Europe solid within a matter of months – probably as a result of meltwater from retreating glaciers shutting down the Atlantic Ocean’s “conveyor-belt” current, although a cometary impact has also been blamed.
Twelve thousand years ago, the great ice sheets retreated at the beginning of the latest interglacial – the Flandrian – allowing humans to return to northern latitudes. This period has been relatively warm, and the climate relatively stable, although it has been slightly colder than the last interglacial, the Eemian, and sea levels are currently at least 3 metres lower – differences that are being closely scrutinised by researchers keen to understand how our climate will develop.
But this respite from the ice is likely to prove short-lived, at least in geological terms. Human effects on the climate notwithstanding, the cycle will continue to turn, the hothouse period will some day come to an end – and the ice sheets will descend again."
Nature abhors a positive feedback - Bryce Johnson
"The purpose of the article is to contribute to refuting the false alarm that has been generated worldwide about excess global warming caused by atmospheric carbon dioxide, primarily by mischaracterizing its inherently negative feedback.
Feedback is the effect that the result of a process has on itself. Positive feedback augments the result and negative feedback diminishes it. A negative feedback does not preclude an increase in the results of a process but it does limit the ultimate magnitude of the increase. Most feedbacks in nature are negative or soon become negative. Otherwise we would have been destroyed by nature some time ago. Positive feedbacks can cause runaway effects. Nature abhors a positive feedback."
Why an ice age occurs every 100,000 years: Climate and feedback effects explained
"Science has struggled to explain fully why an ice age occurs every 100,000 years. As researchers now demonstrate based on a computer simulation, not only do variations in insolation play a key role, but also the mutual influence of glaciated continents and climate."
- Understanding the global warming debate
- Denying the Catastrophe: The Science of the Climate Skeptic's Position
- Warren's own model
Top physicist - Freeman Dyson
A MATHEMATICAL discovery by Perth-based electrical engineer Dr David Evans
may change everything about the climate debate, on the eve of the UN climate change conference in Paris next month.
What scientists say about climate change? Does the data validate the politicians, celebrities and journalists who say humans are causing the earth to catastrophically warm? Richard Lindzen, an MIT atmospheric physicist and one of the world's leading climatologists, summarizes the science behind climate change..
Dr Tim Ball Crushes Climate Change
'Hockey Stick' Mann takes Tim Ball to Court - Backfires
Yes, the Ocean has Warmed, No, it's not Global Warming
Ocean Indicators Suggest that CO2 is not the Strongest Driver of Climate
The history of ice on Earth
"The cool temperatures of the Quaternary may have allowed our brains to become much larger than those of our of hominid ancestors. While that’s still open to debate, it’s plausible that the most recent glacial period left its mark on our species.
Neanderthals, with whom we shared the planet until just before the last glacial maximum, 20,000 years ago, may have struggled to survive as the rising and falling ice ate away at their habitat – although many other explanations for their extinction have been suggested. What is beyond doubt is that Homo sapiens survived and turned to farming soon after the ice retreated, setting the stage for the rise of modern civilisation.
As the glacial period drew to a close and temperatures began to rise, there were two final cold snaps. First, the chilly “Older Dryas” of 14,700 to 13,400 years ago transformed most of Europe from forest to tundra, like modern-day Siberia. After a brief respite, the Younger Dryas, between 12,800 to 11,500 years ago, froze Europe solid within a matter of months – probably as a result of meltwater from retreating glaciers shutting down the Atlantic Ocean’s “conveyor-belt” current, although a cometary impact has also been blamed.
Twelve thousand years ago, the great ice sheets retreated at the beginning of the latest interglacial – the Flandrian – allowing humans to return to northern latitudes. This period has been relatively warm, and the climate relatively stable, although it has been slightly colder than the last interglacial, the Eemian, and sea levels are currently at least 3 metres lower – differences that are being closely scrutinised by researchers keen to understand how our climate will develop.
But this respite from the ice is likely to prove short-lived, at least in geological terms. Human effects on the climate notwithstanding, the cycle will continue to turn, the hothouse period will some day come to an end – and the ice sheets will descend again."
Nature abhors a positive feedback - Bryce Johnson
"The purpose of the article is to contribute to refuting the false alarm that has been generated worldwide about excess global warming caused by atmospheric carbon dioxide, primarily by mischaracterizing its inherently negative feedback.
Feedback is the effect that the result of a process has on itself. Positive feedback augments the result and negative feedback diminishes it. A negative feedback does not preclude an increase in the results of a process but it does limit the ultimate magnitude of the increase. Most feedbacks in nature are negative or soon become negative. Otherwise we would have been destroyed by nature some time ago. Positive feedbacks can cause runaway effects. Nature abhors a positive feedback."
Why an ice age occurs every 100,000 years: Climate and feedback effects explained
"Science has struggled to explain fully why an ice age occurs every 100,000 years. As researchers now demonstrate based on a computer simulation, not only do variations in insolation play a key role, but also the mutual influence of glaciated continents and climate."
Climate and Civilisation Over the Last 18,000 Years - an Essay
“The next century of human-made global warming is predicted to be far less extreme than that which occurred at 9600 BC [11,600 BP]. At the end of the Younger Dryas, mean global temperature had risen by 7°C in fifty years, whereas the predicted rise for the next hundred years is less than 3°C. The end of the last ice age led to a 120 meter increase in sea level, whereas that predicted for the next fifty years is a paltry 32 centimeters at most,…”
“The next century of human-made global warming is predicted to be far less extreme than that which occurred at 9600 BC [11,600 BP]. At the end of the Younger Dryas, mean global temperature had risen by 7°C in fifty years, whereas the predicted rise for the next hundred years is less than 3°C. The end of the last ice age led to a 120 meter increase in sea level, whereas that predicted for the next fifty years is a paltry 32 centimeters at most,…”
| younger_dryas_to_present_time_line_updated2.pdf | |
| File Size: | 4619 kb |
| File Type: | |
Abstract:
“Our key conclusion is there is no need for anthropogenic emissions of greenhouse gases (GHGs), and even less so for livestock-born emissions, to explain climate change. Climate has always been changing, and even the present warming is most likely driven by natural factors. The warming potential of anthropogenic GHG emissions has been exaggerated, and the beneficial impacts of manmade CO2 emissions for nature, agriculture, and global food security have been systematically suppressed, ignored, or at least downplayed by the IPCC (Intergovernmental Panel on Climate Change) and other UN (United Nations) agencies. Furthermore, we expose important methodological deficiencies in IPCC and FAO (Food Agriculture Organization) instructions and applications for the quantification of the manmade part of non-CO2-GHG emissions from agro-ecosystems. However, so far, these fatal errors inexorably propagated through scientific literature. Finally, we could not find a clear domestic livestock fingerprint, neither in the geographical methane distribution nor in the historical evolution of mean atmospheric methane concentration.”
|
Full study download
|
| ||||||
|
|
Dr. Judith Curry is Professor and former Chair of the School of Earth and Atmospheric Sciences at the Georgia Institute of Technology
|
|
Mototaka Nakamura on the modelling of climate change
Confessions of a climate scientist The global warming hypothesis is an unproven hypothesis |
A blog on a variety of matters regarding the claims about climate science and the forecast changes
100 YEARS OF MEAN SEA LEVELS AT FORT DENISON, SYDNEY:
1914 – 1.11 metres
1924 – 0.98 metres
1934 – 0.98 metres
1944 – 0.97 metres
1954 – 1.00 metres
1964 – 1.09 metres
1974 – 1.09 metres
1984 – 1.02 metres
1994 – 1.04 metres
2004 – 1.08 metres
2014 – 1.12 metres
2019 – 1.05 metres
Accordingly, the mean sea level at Sydney in 2019 is 6 centimetres lower than the mean sea level at Sydney in 1914 when the Bureau Of Meteorology commenced recording Mean Sea Level. Dan Fitzhenry.
Is CO2 driving temperature - what do you think?
From Warren Meyer - link to article above
Cross posted from Coyoteblog
"UPDATE ON MY CLIMATE MODEL (SPOILER: IT’S DOING A LOT BETTER THAN THE PROS)
In this post, I want to discuss my just-for-fun model of global temperatures I developed 6 years ago. But more importantly, I am going to come back to some lessons about natural climate drivers and historic temperature trends that should have great relevance to the upcoming IPCC report.
In 2007, for my first climate video, I created an admittedly simplistic model of global temperatures. I did not try to model any details within the climate system. Instead, I attempted to tease out a very few (it ended up being three) trends from the historic temperature data and simply projected them forward. Each of these trends has a logic grounded in physical processes, but the values I used were pure regression rather than any bottom up calculation from physics. Here they are:
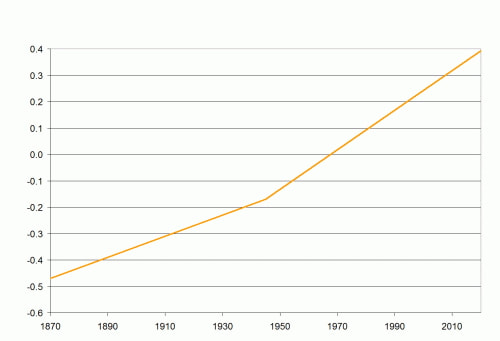
- A long term trend of 0.4C warming per century. This can be thought of as a sort of base natural rate for the post-little ice age era.
- An additional linear trend beginning in 1945 of an additional 0.35C per century. This represents combined effects of CO2 (whose effects should largely appear after mid-century) and higher solar activity in the second half of the 20th century (Note that this is way, way below the mainstream estimates in the IPCC of the historic contribution of CO2, as it implies the maximum historic contribution is less than 0.2C)
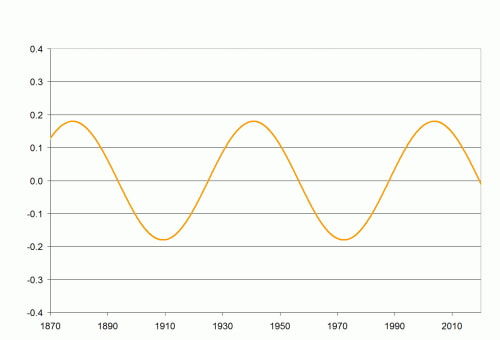
- A cyclic trend that looks like a sine wave centered on zero (such that over time it adds nothing to the long term trend) with a period of about 63 years. Think of this as representing the net effect of cyclical climate processes such as the PDO and AMO.
And the cyclic trend:
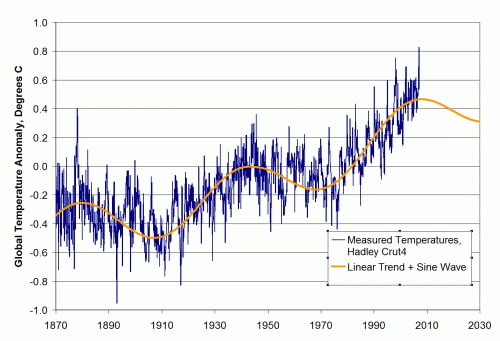
These two charts are simply added and then can be compared to actual temperatures. This is the way the comparison looked in 2007 when I first created this “model”
The historic match is no great feat. The model was admittedly tuned to match history (yes, unlike the pros who all tune their models, I admit it). The linear trends as well as the sine wave period and amplitude were adjusted to make the fit work.
However, it is instructive to note that a simple model of a linear trend plus sine wave matches history so well, particularly since it assumes such a small contribution from CO2 (yet matches history well) and since in prior IPCC reports, the IPCC and most modelers simply refused to include cyclic functions like AMO and PDO in their models. You will note that the Coyote Climate Model was projecting a flattening, even a decrease in temperatures when everyone else in the climate community was projecting that blue temperature line heading up and to the right.
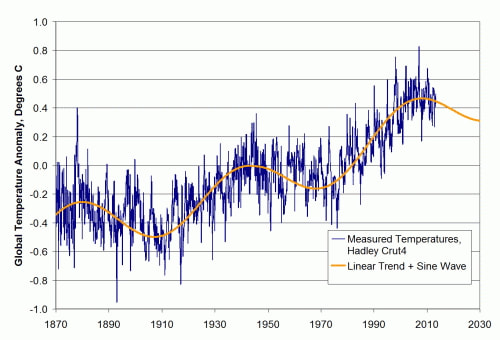
So, how are we doing? I never really meant the model to have predictive power. I built it just to make some points about the potential role of cyclic functions in the historic temperature trend. But based on updated Hadley CRUT4 data through July, 2013, this is how we are doing
Not too shabby. Anyway, I do not insist on the model, but I do want to come back to a few points about temperature modeling and cyclic climate processes in light of the new IPCC report coming soon.
The decisions of climate modelers do not always make sense or seem consistent. The best framework I can find for explaining their choices is to hypothesize that every choice is driven by trying to make the forecast future temperature increase as large as possible. In past IPCC reports, modelers refused to acknowledge any natural or cyclic effects on global temperatures, and actually made statements that a) variations in the sun’s output were too small to change temperatures in any measurable way and b) it was not necessary to include cyclic processes like the PDO and AMO in their climate models.
I do not know why these decisions were made, but they had the effect of maximizing the amount of past warming that could be attributed to CO2, thus maximizing potential climate sensitivity numbers and future warming forecasts. The reason for this was that the IPCC based nearly the totality of their conclusions about past warming rates and CO2 from the period 1978-1998. They may talk about “since 1950”, but you can see from the chart above that all of the warming since 1950 actually happened in that narrow 20 year window. During that 20-year window, though, solar activity, the PDO and the AMO were also all peaking or in their warm phases. So if the IPCC were to acknowledge that any of those natural effects had any influence on temperatures, they would have to reduce the amount of warming scored to CO2 between 1978 and 1998 and thus their large future warming forecasts would have become even harder to justify.
Now, fast forward to today. Global temperatures have been flat since about 1998, or for about 15 years or so. This is difficult to explain for the IPCC, since about none of the 60+ models in their ensembles predicted this kind of pause in warming. In fact, temperature trends over the last 15 years have fallen below the 95% confidence level of nearly every climate model used by the IPCC. So scientists must either change their models (eek!) or else they must explain why they still are correct but missed the last 15 years of flat temperatures.
The IPCC is likely to take the latter course. Rumor has it that they will attribute the warming pause to… ocean cycles and the sun (those things the IPCC said last time were irrelevant). As you can see from my model above, this is entirely plausible. My model has an underlying 0.75C per century trend after 1945, but even with this trend actual temperatures hit a 30-year flat spot after the year 2000. So it is entirely possible for an underlying trend to be temporarily masked by cyclical factors.
BUT. And this is a big but. You can also see from my model that you can’t assume that these factors caused the current “pause” in warming without also acknowledging that they contributed to the warming from 1978-1998, something the IPCC seems loath to do. I do not know how the ICC is going to deal with this. I hate to think the worst of people, but I do not think it is beyond them to say that these factors offset greenhouse warming for the last 15 years but did not increase warming the 20 years before that.
We shall see. To be continued…."
Why did you change your your views on climate change? Greg Boyd
"My advice is to continue to recycle, buy less junk, give money to charities who try and prevent deforestation and remove plastic from the oceans, support initiatives to create more fishing–free zones around the world, support initiatives to educate and bring energy to developing nations, support public transport, support new forms of nuclear energy, buy an electric car if you want, or don’t – but above all enjoy your life and stop worrying about human caused catastrophic climate change.
We may just be scaring ourselves to death due to a lot of BS, a misunderstanding, an insidious conspiracy, political ideology, greed and egos, by humanity’s predisposition to a cataclysmic mindset, or all of the above.
Inconvenient Facts
Gregory Wrightstone
Gregory Wrightstone
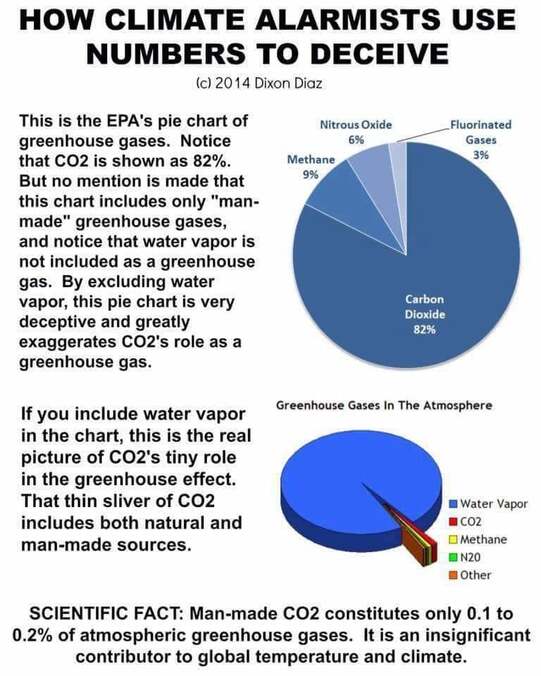
- CO2 is not the primary greenhouse gas
- The warming effect of CO2 declines as its concentration increases.
- First and foremost CO2 is plant food.
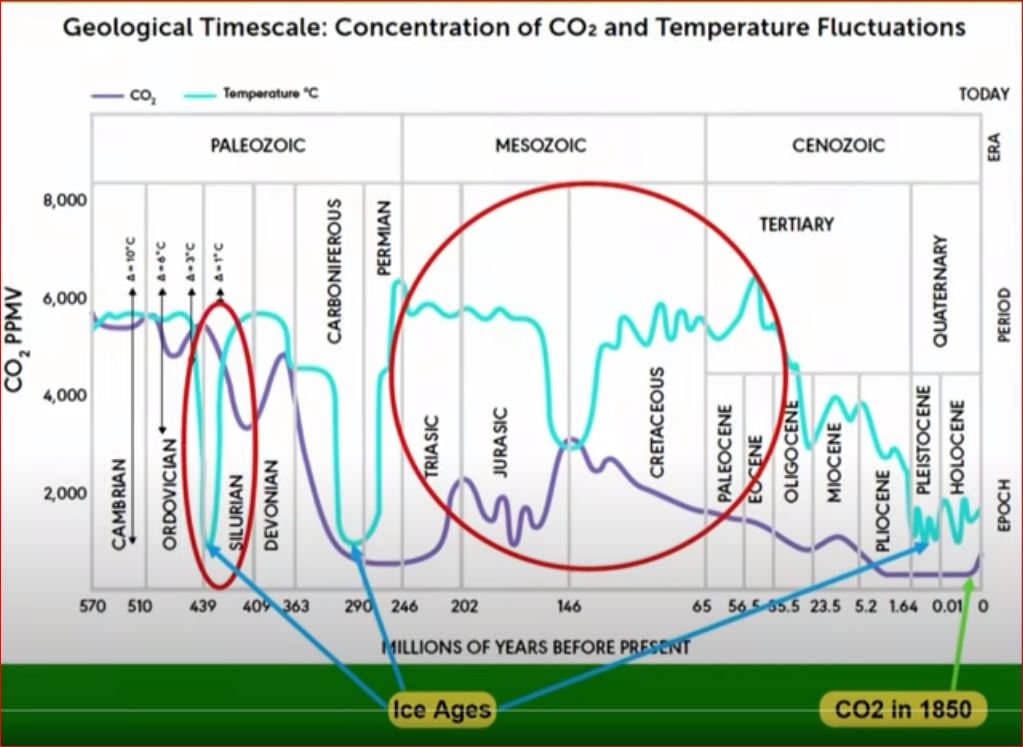
- In the last 4 ice ages the CO2 level was dangerously low.
- 140 million year trend of dangerously decreasing CO2.
- Our current geologic period, Quaternary, has the lowest average CO2 levels in the history of the earth.
- More CO2 means more plant growth.
- More CO2 helps to feed more people worldwide.
- More CO2 means moister soil.
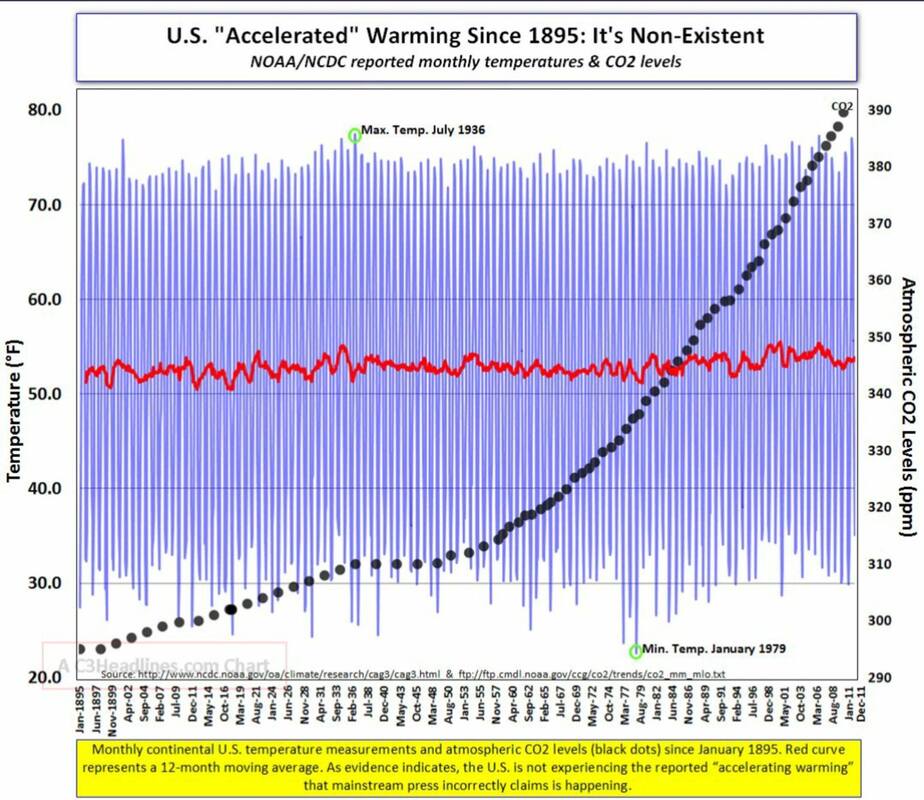
- Recent inconvenient pause of 18 years in warming despite rise in CO2.
- CO2 rose after the Second Wold War but temperature fell.
- Modern warming began long before SUV’s or coal fired plants.
- Melting glaciers and rising seas confirm warming predated increases of CO2.
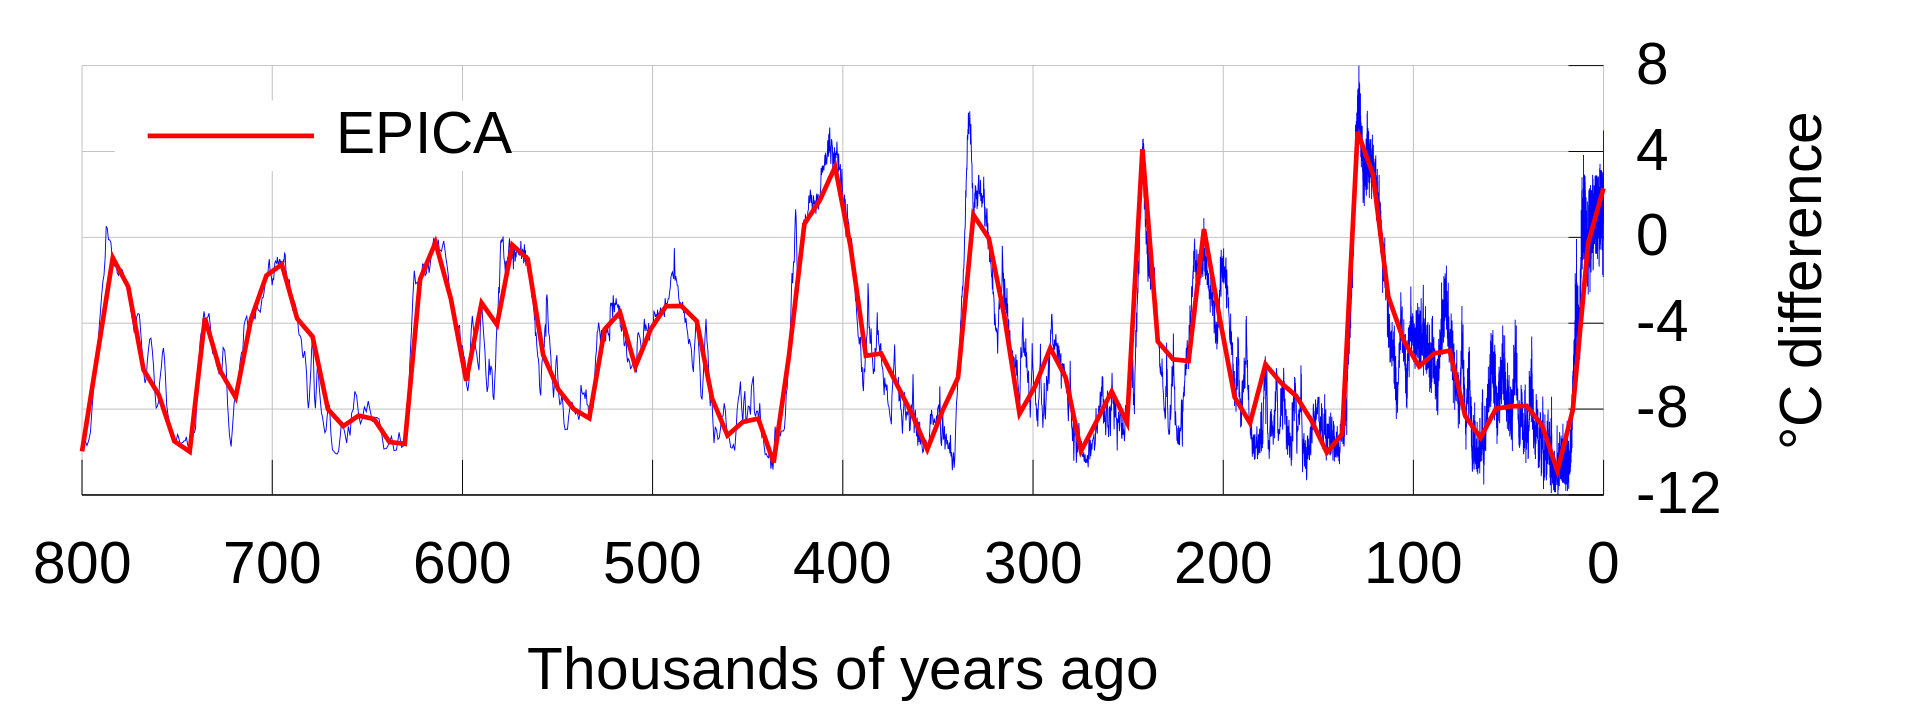
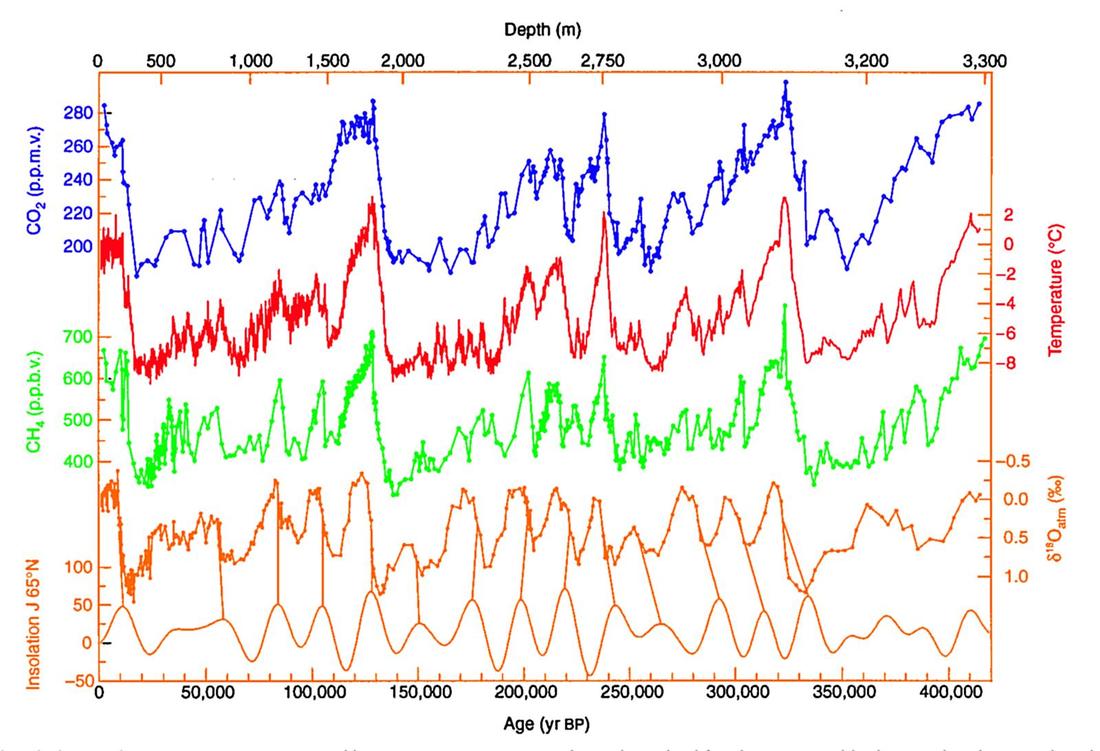
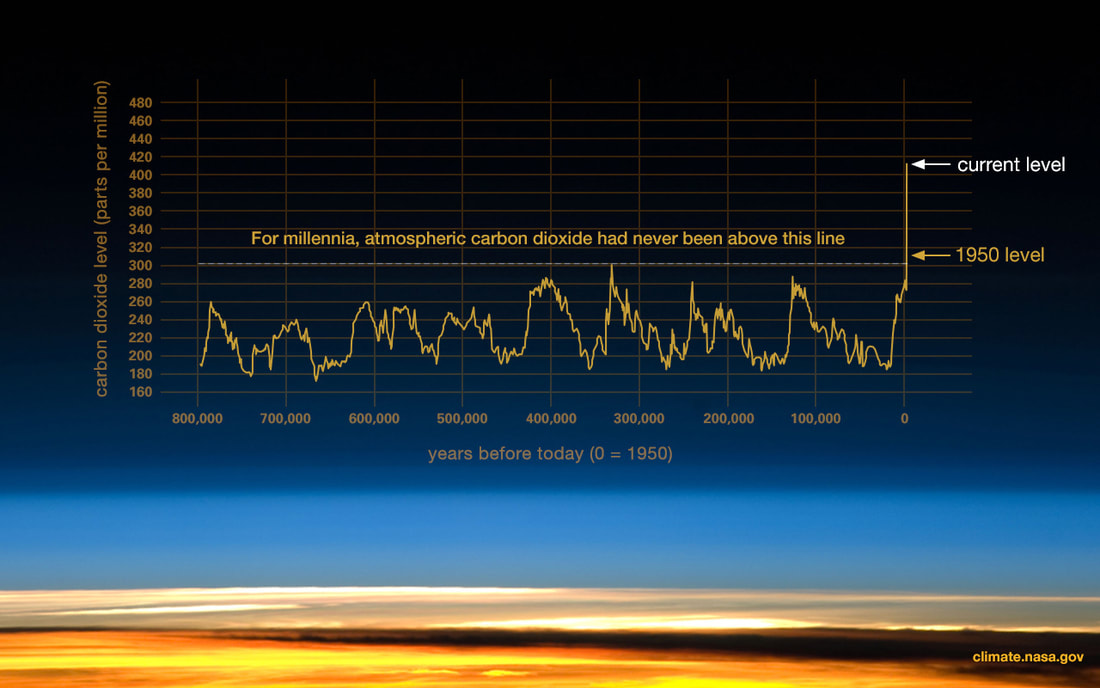
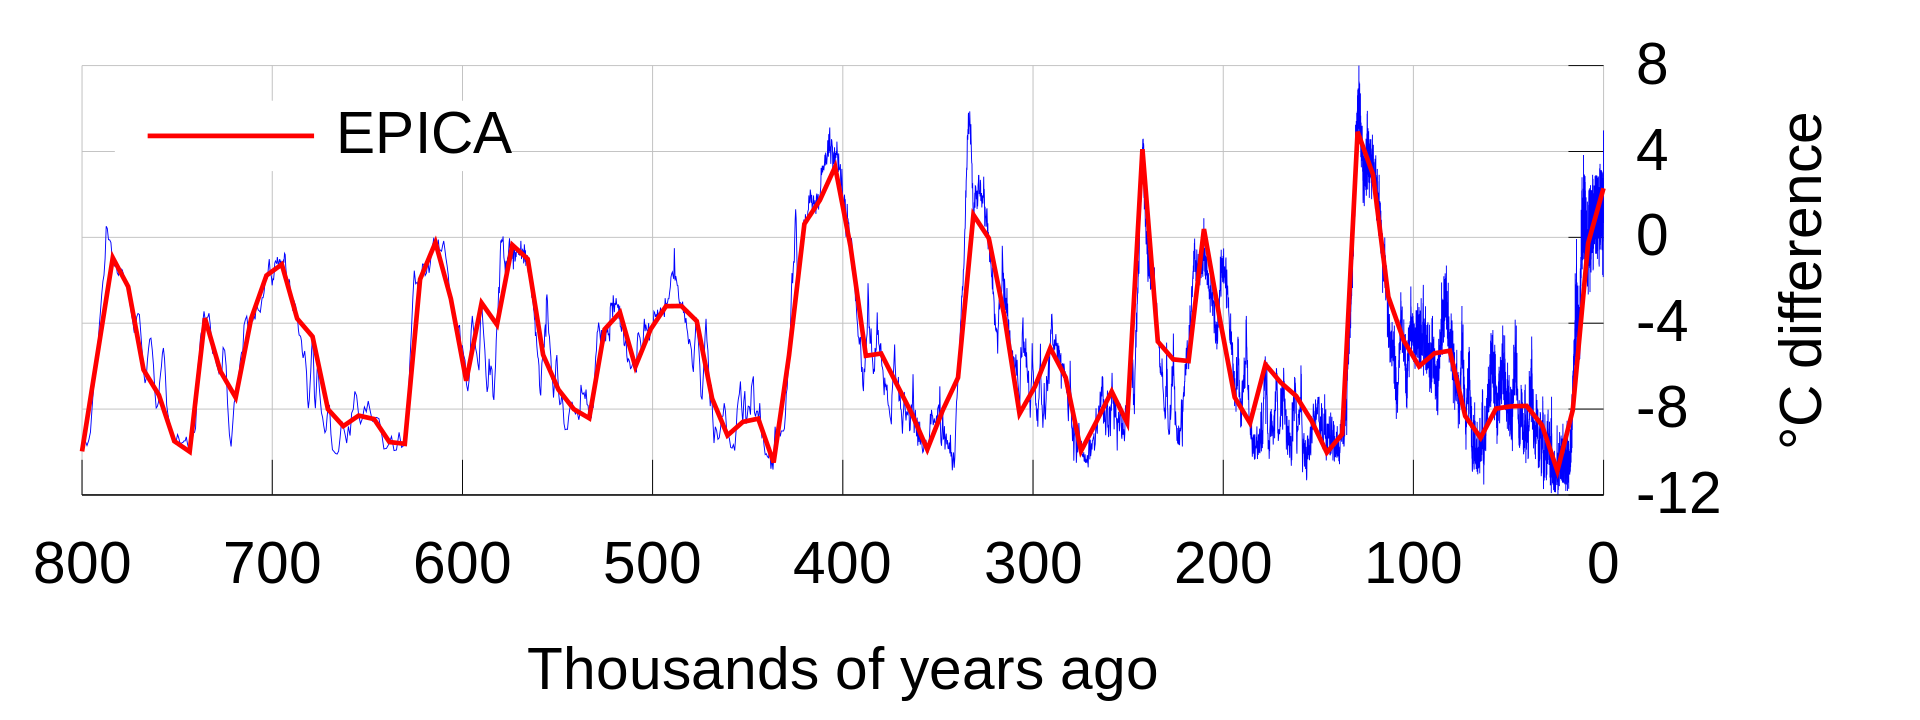
- Temperatures have changed for 800,000 years, it wasn’t us.
- Interglacials usually last 10,000 to 15,000 years. Ours is 11,000 years old.
- Each of the 4 previous interglacial warming periods were significantly warmer than our current temperature.
- The last interglacial, about 120,000 years ago was 8 degrees Celsius, 14.4 degrees Fahrenheit warmer than today. The polar bears survived. Greenland didn’t melt.
- Temperatures changed during the past 10,000 years. It wasn’t us.
- Today’s total warming and warming rate are similar to earlier periods.
- It was warmer than today for 6,100 of the last 10,000 years.
- Our current trend is neither unusual nor unprecedented.
- Earth’s orbit and tilt drive glacial interglacial changes.
- We are living in one of the coldest periods in all of earth’s history.
- Earth has not had a geologic period this cold in 250 million years.
- The only thing constant about temperatures over 600 million years is that they have been constantly changing. This is a recurring inconvenient fact.
- For most of earth’s history it was about 10 degrees celsius, 18 degrees Fahrenheit, warmer than today.
- IPCC models overstate future warming up to 3x too much.
- For human advancement, warmer is better than colder.
- A return to the temperature at the beginning of the industrial revolution would lead to famine and death.
- Only about 0.3% of published scientists stated in their papers that recent warming was mostly man made.
- Science is not consensus and consensus is not science.
- More CO2 implies fewer droughts.
- Higher temperatures implies fewer droughts.
- Forest fires across the northern hemisphere are decreasing.
- More CO2 leads to more CO2 fertilisation leads to more soil moisture leads to faster tree growth leads to fewer forest fires.
- More CO2 in the atmosphere means more food for everyone.
- The earth is becoming greener not turning into desert.
- Growing seasons are lengthening.
- More CO2 and warmer weather mean more world food production.
- EPA heat waves are not becoming more frequent.
- Extreme heat events are declining.
- Cold kills far more people every year than heat.
- Warmer weather means many fewer temperature related deaths.
- Warmer weather prevents millions of premature deaths each year.
- More CO2 and warmth means shorter and less intense heatwaves.
- Number of tornadoes is declining.
- The number of tornadoes in 2016 was the lowest on record.
- Deaths from tornadoes are falling.
- There has been no increase in frequency of hurricanes in recent data.
- We have seen 250 years of declining hurricane frequency.
- No significant increase in hurricane intensity due to warming.
- The population of polar bears is growing.
- There are more polar bears than we’ve had for 50 years.
- Polar bears are thriving even where sea ice is diminishing.
- There is no historic correlation between CO2 and oceanic pH.
- The oceans did not become acidic even at 15x modern CO2 levels.
- Sea level increase began more than 15,000 years ago.
- Recent sea level rise began 150 years before the increase in CO2.
- Melting the northern polar ice cap would not increase sea level.
- Most of Antarctica is cooling and gaining ice mass.
