Gregg's Health Notes
|
Tracking Lipid Results by Lifestyle Changes
Had new tests today (17 August 2015) and they will replace the 'pending' when I get the results. The physician has only just put up the 2014 results today (presumably because this is the first time he has discussed them with me). Hopefully, I'll get the new results before I go back to see him in 2 weeks. As can be seen, back in 2010 I was heavier and still climbing to the 90kg that I would eventually carry before I got started on LCHF (about April 2013). The lipid panel was probably fairly typical for my age and lifestyle. I have no idea what the levels were like immediately prior to starting LCHF - but I suspect they were similar to the October 2013 levels. The physician didn't get too excited by those results but asked me if I'd started "one of those 'fat' diets?" (I guess he was looking at the elevated trigs and guessing they were a result of me mobilising fat during weight loss. In May 2014, I had had surgery for haemorrhoids and the doc suggested a lipid panel might be in order since it had been nearly a year from last one. I remarked that I was unimpressed by the lipid tests and the undue importance assigned to them by the medical profession, in general, particularly in light of the fact that they didn't differentiate between LDL particles or counts. He suggested perhaps I could do an Apo A1 /Apo B screen - to which I acquiesced. He never got back to me and I never got back to him - but I noticed the results never came up in my online access. Well it turns out that the hospital board didn't do the screening because "Apolipoprotein A1 & Apolipoprotein B has not been performed as the results usually provide very little additional information and are not performed routinely in Waikato Hospital Laboratory." They did, however, carry out the normal lipid panel and that has now been updated on the table below. What is perhaps interesting, is the progress after a year of LCHF. Clearly the LCHF has had some effect on the movement of markers toward what the dogma would have us believe are 'improvements'. It remains to be seen what effect the 'zero plant' lifestyle has on the next lot. [According to the studies referenced in the link below the table, "Mortality by Cholesterol Levels", the October 2013 results should be the best results for a long life - contrary to what the current 'authorities' would have you believe.] |
Update: Results have come in and they aren't all that spectacular. Triglycerides are lower than in 2010 and HDL is higher. LDL is fairly meaningless until they work out how do to particle count in New Zealand. It might be early days yet, on the zero carb trip, (being only 4 months in). One thing I'm curious about is why the C-Reactive Protein (bottom table) has elevated to 11. Something must be going on - but what?
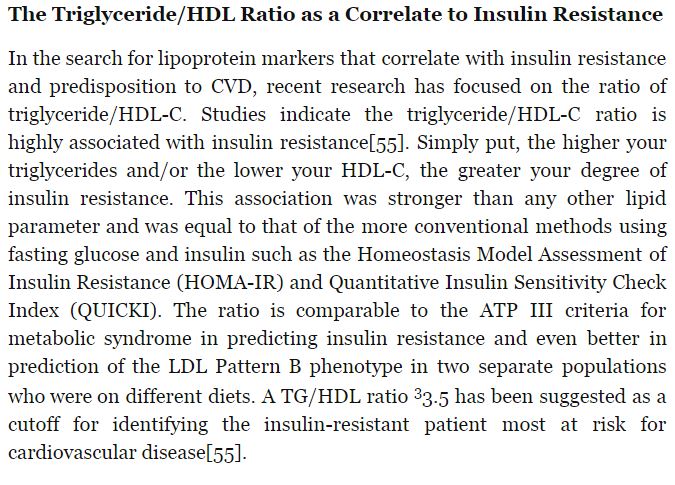
On another note, after reading Phinney and Volek, it transpires that the calculation of TG/HDL gives a reasonable surrogate for working out the LDL particle size. "Values of TG/HDL-C over 3.5 indicate that you probably have pattern B with a predominance of small LDL particles, and a ratio this high indicates there's a good chance you may also have insulin resistance."
As can be seen from the ratios, I did get up to 4 back in 2013 but have dropped back quite well over the next two blood tests, indicating that my LDL particles are pattern A, with a predominance of the large fluffy style. I will just have to explain it slowly to the physician.
Further Update: I did further research and found that the triglycerides have to be converted by a different number before a sensible ratio can be calculated for TG/HDL-C. So I got all that wrong above and the ratios now indicate predominantly pattern B.
July 2016 Update: Now been 15 months on zero-carb (zero plant) diet. Got vitamin D assay done to see if my supplementation has been effective (and it has). It has gone from 61 nmol/L in September 2015 to 178 nmol/L 10 months later.
I got a lipid panel done at the same time (really to see how triglycerides were going), and triglycerides have dropped considerably (down to 1.2 mmol/L) the ratio TG:HDL-C of 2.5 (using American numbers) indicating that my LDL is now predominantly pattern A and that I am not as insulin resistant as I might have been in the past.
The Art and Science of Low Carbohydrate Living - Phinney and Volek
Mortality by Cholesterol Levels
"According to the NHS Choices website TC should be less than 5.0 mmol/L and LDL cholesterol should be less than 3.0 mmol/L. All the information quoted above [in the link] demonstrates that for people over 60 years old these levels are associated with an increase in all-cause mortality. For older people it is evident that the higher the TC value the lower the death rate. It is difficult to understand why the relevant public policy places so much emphasis on cholesterol reduction."
"According to the NHS Choices website TC should be less than 5.0 mmol/L and LDL cholesterol should be less than 3.0 mmol/L. All the information quoted above [in the link] demonstrates that for people over 60 years old these levels are associated with an increase in all-cause mortality. For older people it is evident that the higher the TC value the lower the death rate. It is difficult to understand why the relevant public policy places so much emphasis on cholesterol reduction."
Spreadsheet View of History
Blood Pressures Over Time
Ketone Readings
Water Tracking - For Esmée
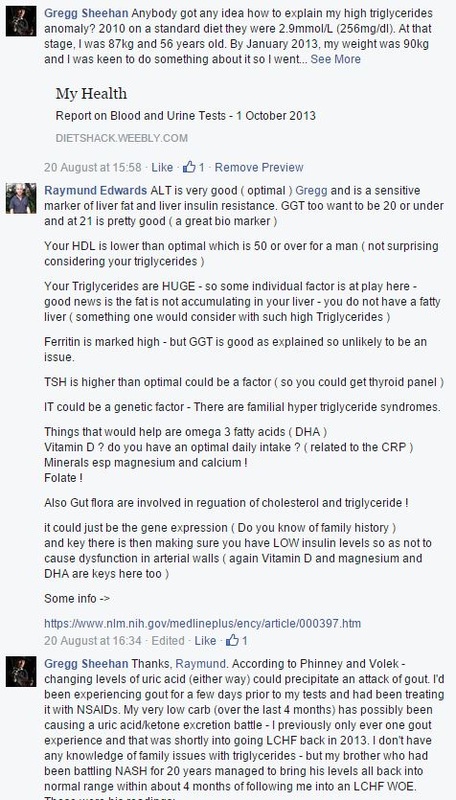
Report on Blood and Urine Tests - 1 October 2013


