 According to the New Zealand Ministry of Health "Cardiovascular Disease Risk Assessment - Updated 2013" adjunct to the New Zealand Primary Care Handbook 2012. We are expected to comply with some form of lipid-lowering strategy to achieve "moderate reduction in LDL-C"
But this month the president of the American College of Cardiologists has come out with the following:
Later the handbook urges a diet largely free of saturated fat.
But the most recent meta-analyses of studies on the subject appearing in the BMJ says that saturated fats are not associated with CVD.
Furthermore, in the UK, where consumption of saturated fat has reduced by half in the period 1969-2000, incidence of obesity has almost doubled since 1993, lifetime risk of developing bowel cancer has doubled from 1975 to 2008, breast cancer rates have not quite doubled, while diabetes has more than doubled in the period 1994-2010. In contrast, Spain which has cut carbohydrate intake dramatically, while equally dramatically increasing meat consumption, have experienced decreased mortality in coronary heart disease and strokes. [3] Lastly, the urgings to minimise salt in our diet is counter-productive to our good health. Sodium is essential for correct functioning of our bodies and unless we have a minimum of 2500mg per day we increase our risk of heart attack. Current maximum recommended by health authorities is 2, 300. A summary of 23 studies, published in the American Journal of Hypertension, less than 2,500mg of sodium will deregulate aldosterone, raise plasma renin activity, increase insulin resistance, activate sympathetic nerve activity (fight or flight response), increases serum cholesterol and triglyceride levels - all of which are increased risk factors for CVD. On the other hand, another study shows increases in dietary sodium to be beneficial in decreasing plasma apolipoprotein B. More recent analysis of multiple studies shows a 'J' curve with regard to dietary sodium and mortality - too little and mortality increases and too much causes the same result. The current maximum puts us on the 'too little' part of the curve. REFERENCES
0 Comments
But will it be mine or my doctors?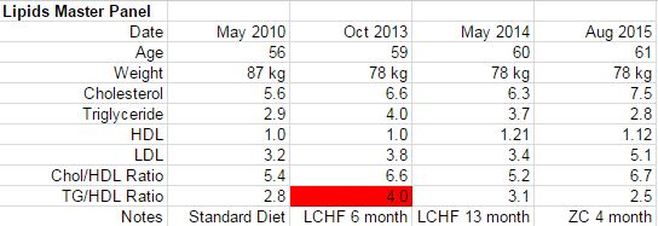 Well, the latest results are in on my lipids - and I can tell you now that my doctor will be (figuratively - because they use computers now) reaching for his pad marked 'Pfizer' and his pen marked 'Merck', to order up some Simvastatin to put me on post-haste. He will be doing this because, based on the New Zealand Primary Care Handbook 2012 - Cardiovascular Disease Risk Assessment (Updated 2013), I will be at a "'high' (15-20%) risk level, 5-year cardiovascular disease (CVD) risk (fatal and non-fatal)". He will have looked at the systolic blood pressure he measured on Monday (160) - which alarmed him at the time - (he didn't pay attention to me when I said that it was unusually high when I got up that morning but was fine the previous morning). He immediately scheduled a lipid panel and a follow-up appointment for 2 weeks. Well, what is going to arouse him about my latest tests? I'll tell you. First off the total cholesterol is 7.5, the triglycerides are 2.8 and the LDL is 5.1. This makes the TC/HDL ratio 6.7. By all the standards that conventional medicine practitioners in New Zealand follow these are HIGH. These are what will have him reaching for his 'prescription pad'. Now, the last time I had this panel performed we did so on the understanding that we would ask for a screening of apolipoprotein A1 and apolipoprotein B, the test that shows the predominance of the 'good' and 'bad' particles of that notorious LDL that everyone has been fixated about for the last 20-30 years. Well it turns out that the 'lab technician' (loosely called the Chemical Pathologist) at Waikato Hospital, vetoed this screening: "Comment: Apolipoprotein A1 & Apolipoprotein B has not been performed as the results usually provide very little additional information and are not performed routinely in Waikato Hospital Laboratory. Dr Stephen Du Toit , Chemical Pathologist" Well, what a fine fettle. I agreed to do the blood tests because we were going to do some additional screening that would cast some nuances and perhaps tell us something useful and now they dismiss that out of hand. (SMH). Fortunately, Phinney and Volek to the rescue. Recent research shows that we can work out the predominance of Apo A or Apo B by doing a calculation of triglyceride/HDL-C. Any result over 3.5 indicates a higher proportion of the Apo B (the ones that you don't want). I have performed this calculation myself - because they likely don't understand the importance of it in our NZ hospitals - and my doctor will not be up-to-date in these matters. I've put all my results up and will provide a link at the end of this post, but the story goes as follows: My first ever lipid panel was done in 2010 when I was 56 years old, 87kg and on the standard New Zealand diet of grains and all that rubbish. Ignoring all the other results for now the TG/HDL ratio was 2.8. By the beginning of 2013 I had climbed to 90kg and was getting concerned for my weight, starting to research what to do about it. I settled on a low-carb, high-fat way of eating as the most logical (from my research) step and commenced preparing all the meals for my wife and I based on this system - starting around April that year. Within a couple of months, we had both shed about 10kg, with no real effort (as LCHF allows you to eat as much as you like). A lipid panel done about 6 months into the LCHF revealed high trigs (probably a result of greater mobilisation of fatty acids while I was losing weight). But the TG/HDL ratio at that point was 4.0, indicating a predominance of the B pattern. The following year (13 months into LCHF) the ratio was back down to 3.1. Now, the current results (4 months into a new experiment of Zero Carb (food from the animal kingdom only - no plants) show that the ratio has gone to 2.5 - lower than it had been 5 years ago. Update: I had another lipid panel done 14 July 2016 and the results are: 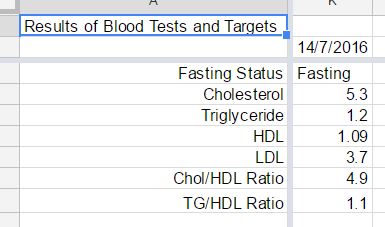 This shows that my TG to HDL has come back to a creditable 1.1 after a year and a half of zero carb. The chart below was more to demonstrate what effect my life-style changes have had on uric acid but also shows the result on the lipids. 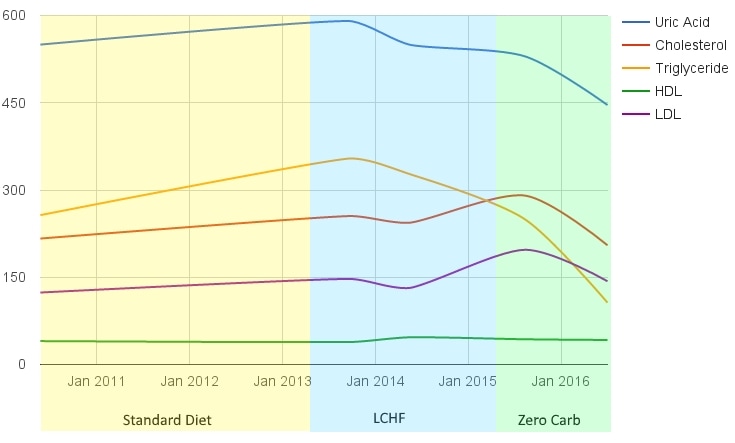 |
Gregg SheehanProblem solver from way back. Currently working on the challenge of weight and health. Hence this website. Archives
November 2020
Categories
All
|
Gregg's Diet Shack
- Journey
- Index
-
Basics
- Discussions by Subject >
- Foods - Nobody does it better than Georgia Ede >
-
The People
>
- Rosedale Lecture
- All Sorts of Links and Videos
- The 20 Myths
- Diet and Nutrition for the Australian People
- Diet, Nutrition and Biochemistry Blogs and Websites
- Discussion on the 'life expectancy' myth
- Micronutrients Veg vs. Meat
- Human History >
- The Fat of the Land
-
Diseases
-
The Studies
- Tools
- Blog
- Quotes
- Recipes
- Articles
- Contact
- RDA
- Liver Flush
- Smacking
- Controversy
- Whisky
- Lentils
- Chad
- IQ
- False
- Falseinfo
- factcheckgood
- factcheckivermectin
- TGC-Licence
- Moccasins
- totalgym
- Law
- Scooters
- Nami
 RSS Feed
